Project Earned Value Analysis
As a project Manager you require information. But not in overloads. The Prommpt project overview module is a top level monitoring tool displaying core metrics from its modules..
Specifically in situations when multiple projects in a project portfolio require quick reviews the project overview module provides with swift insights on a projects status.
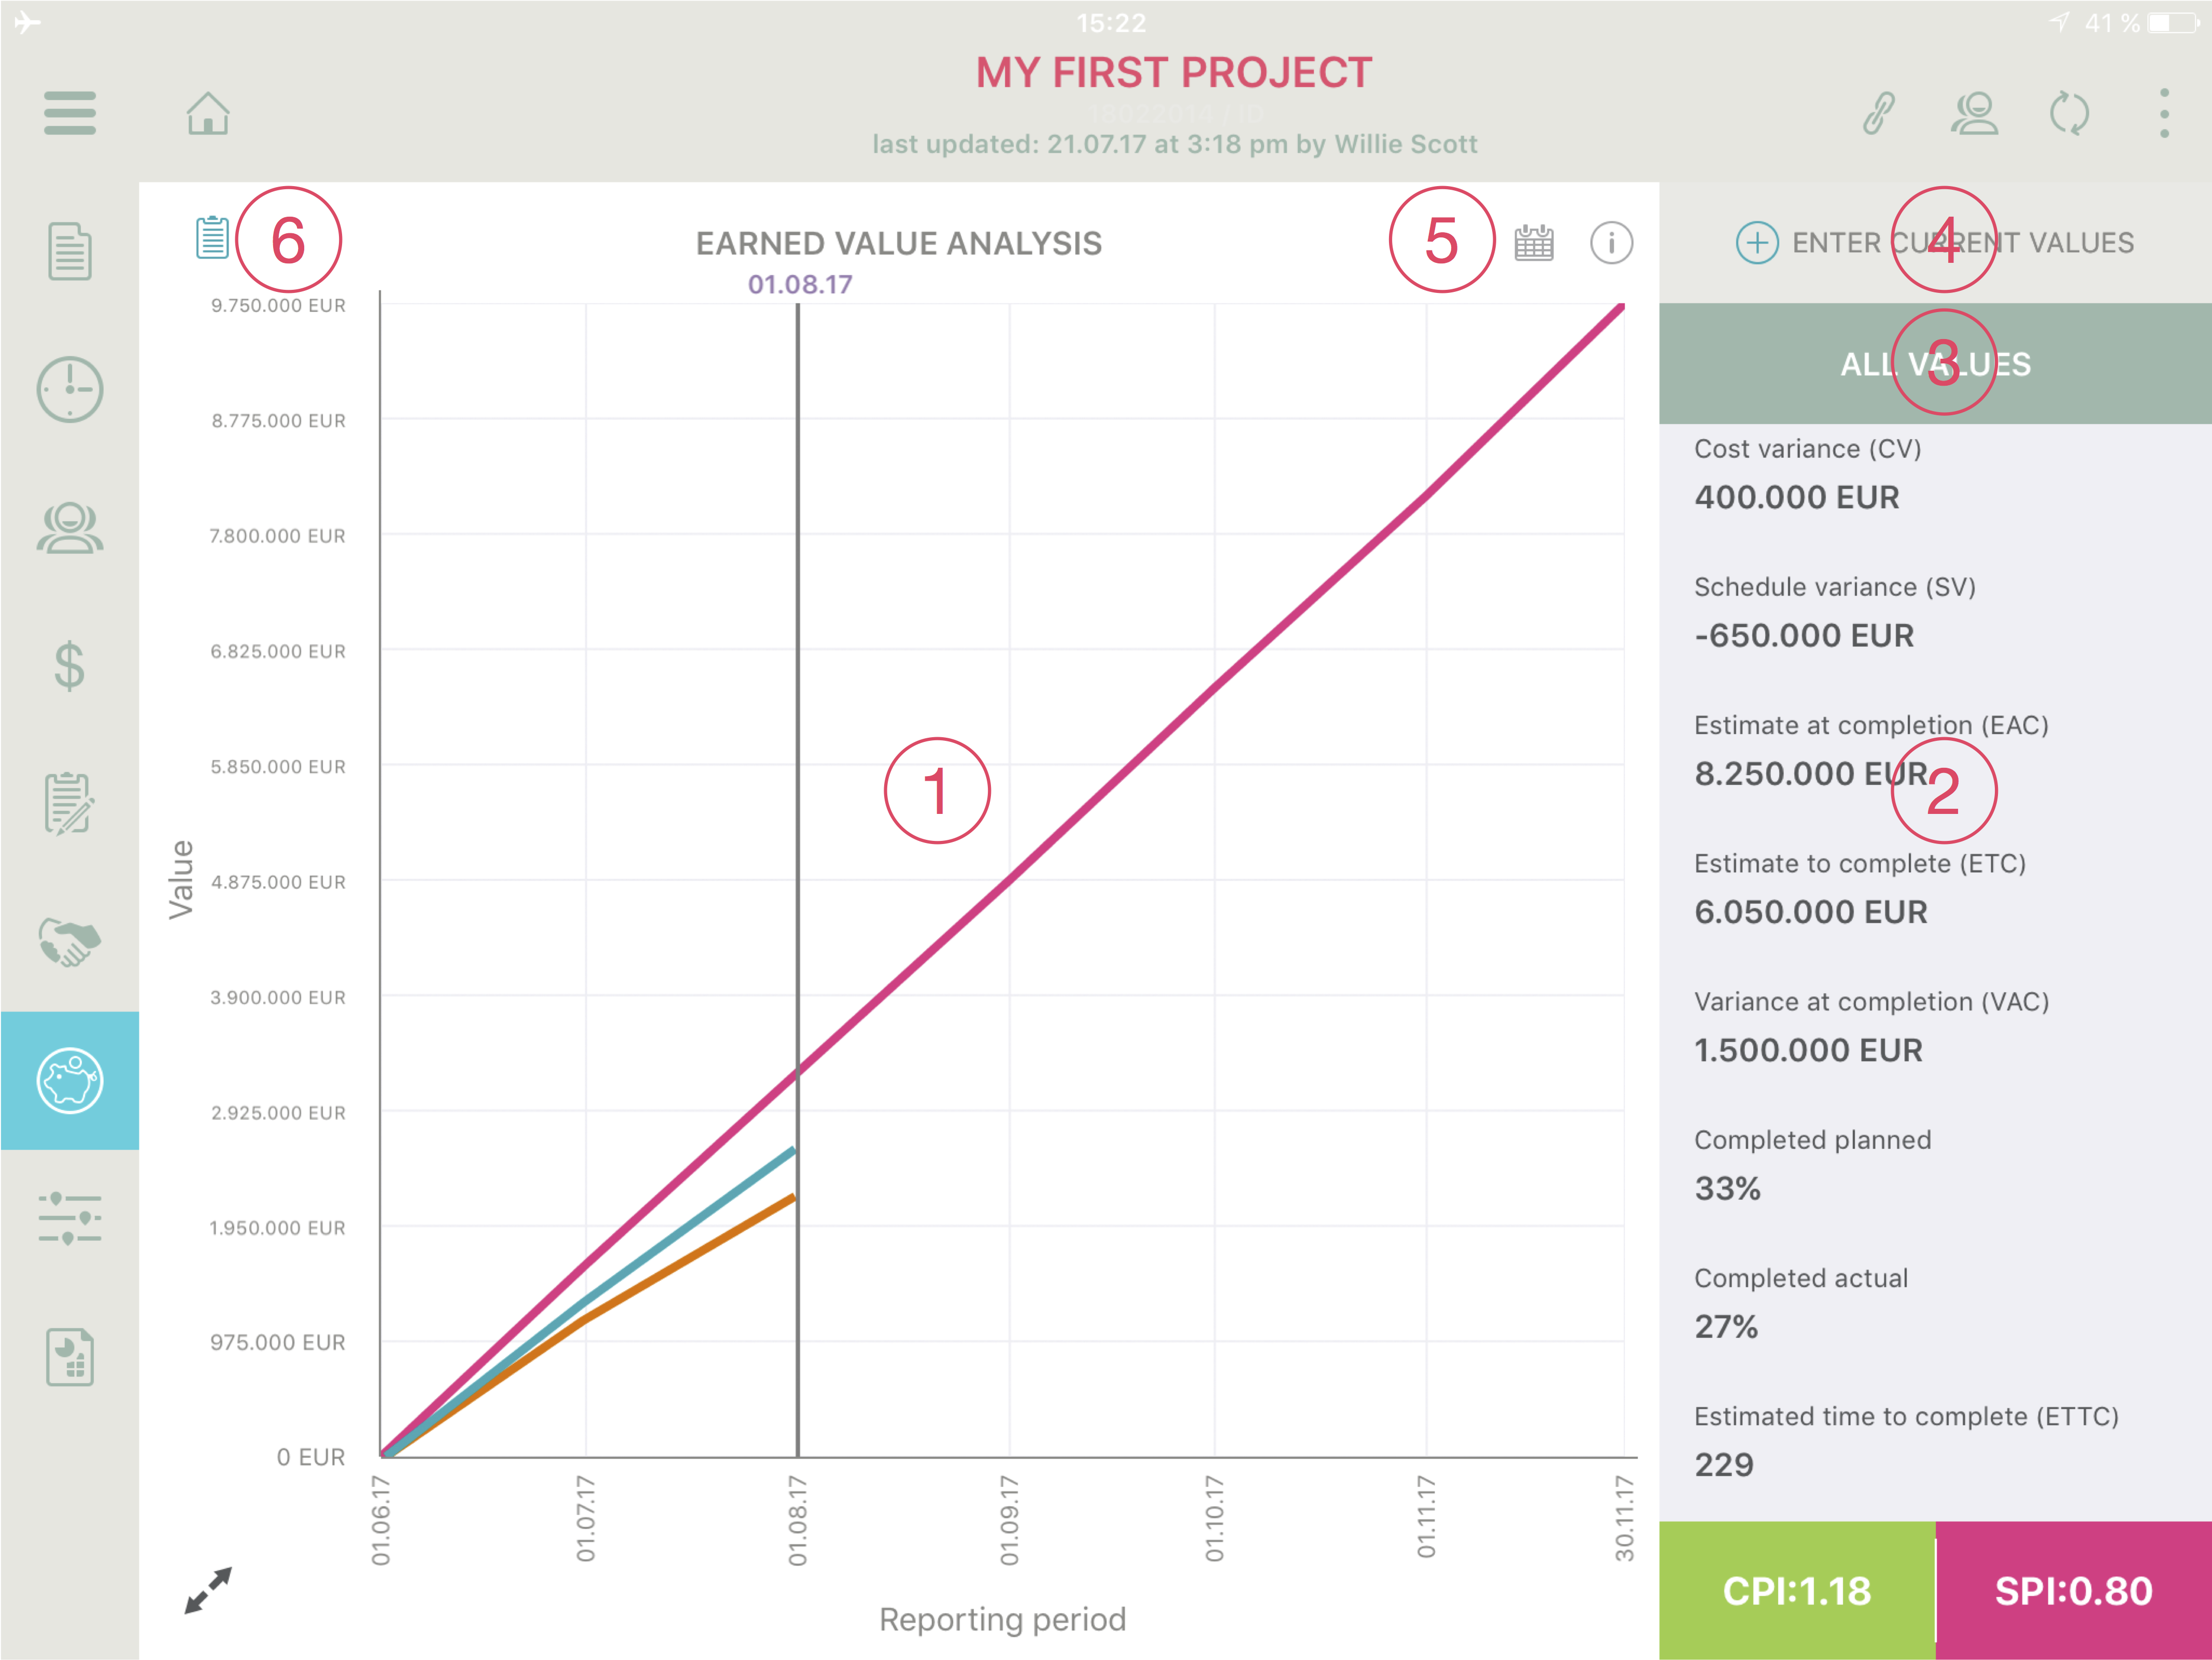
1 Chart area: Those three lines say it all. Red: Planned Value (PV); Green: Earned Value (EV); Orange: Actual Cost (AC).
2 Indicator pane: The right pane can be scrolled up and down to show all major indicators used by the Earned Value Analysis. The Cost Performance Indicator (CPI) and Schedule Performance Indicator (SPI) at the bottom are fixed and change colour per the RAG scheme depending on their value.
Red: Values less then 90% (<0.9)
Amber: Values between 90% and 110% (0.9-1.1)
Green: Values greater than 110% (>1.1)
3 All Values: Tap this button to access and edit all data point (EV and AC entities).
4 Enter current values: Tap here to enter the current values for EC and AC as well as the date on which they are recorded. Note that the values need to be incremental value change in the period and not the accumulated values. Furthermore you can leave a comment or note relating to this specific entry for record keeping purposes.
5 Date picker: The date picker allows to change the status date to any date you are interested in. By default this date is set to TODAY.
6 PV entry: Tap this icon to change to the Planned Value dataset.
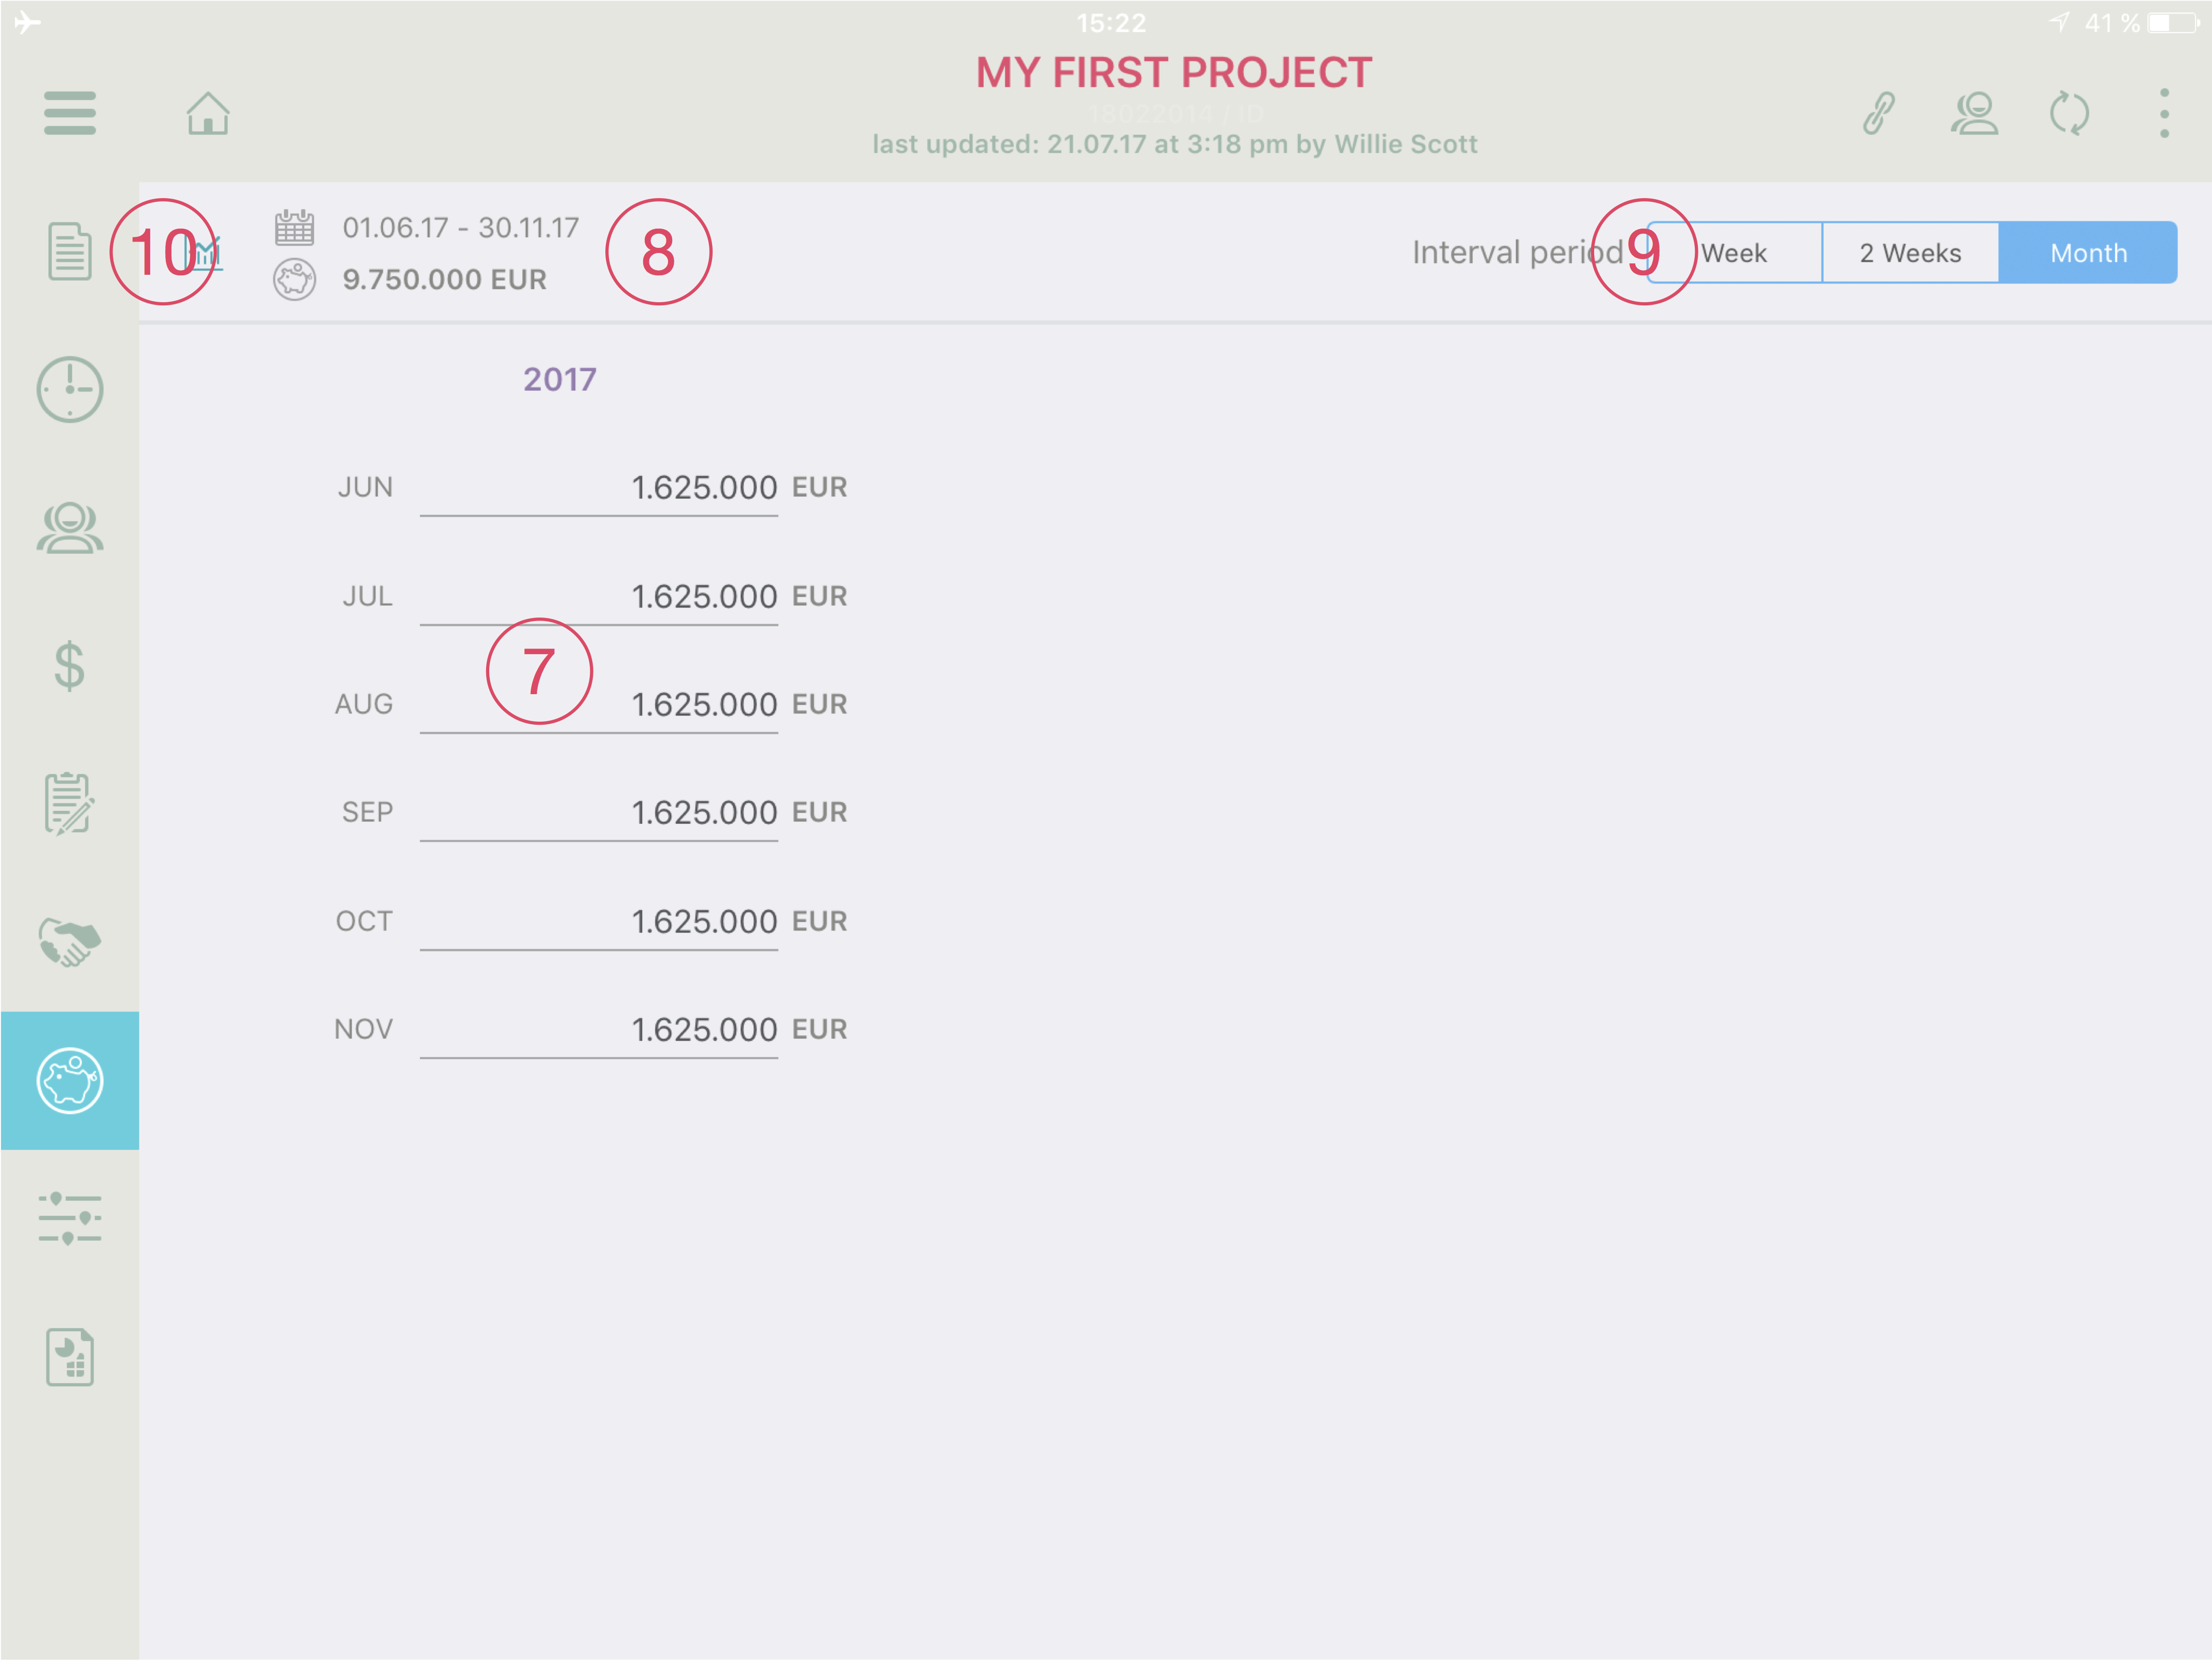
7 Planned values: Depending on your chosen interval period (9) you can enter the anticipated Planned Values per months, fortnights or weeks. The range is calculated depending on the project duration you have set during the setting-up.
8 Base info: These two indicators show you the start and end date you have set for the project as well as the cumulated allocated planned values.
9 Interval period: Here you can select in which intervals you would like to chart out your Planed Values and how granular you intend to manage your project. Projects with a shorter duration require a denser interval than those with a long duration.
10 Chart view: Tap this icon to change to the chart view.